


Introduction
In this article, I'll discuss a project which is to predict heart disease using machine learning algorithms.
Heart disease is a term covering any disorder of the heart.
It refers to conditions that involve the heart, its vessels, muscles, valves, or internal electric pathways responsible for muscular contraction.
One in every four deaths in the U.S. is related to heart disease. One person dies every 37 seconds in the United States from cardiovascular disease.
Due to such constraints, scientists have turned towards modern approaches like Machine Learning, data Mining etc.,
Machine Learning is used across many spheres around the world. The healthcare industry is no exception. It can play an essential role in predicting Heart disease presence and many more.
The data I used in this project is from the Cleveland database from UCI Machine Learning Repository.
Heart Disease Data Dictionary
It contains 76 attributes, but here only 14 attributes will be used. Attributes (also called features) are the variables what we'll use to predict our target variable. In our case, the independent variables are a patients with different medical attributes and the dependent variable is whether or not they have heart disease.
The following are the features we'll use to predict our target variable (heart disease or no heart disease).
- age - age in years
- sex - (1 = male; 0 = female)
- cp - chest pain type
- 0: Typical angina: chest pain related decrease blood supply to the heart
- 1: Atypical angina: chest pain not related to heart
- 2: Non-anginal pain: typically esophageal spasms (non heart related)
- 3: Asymptomatic: chest pain not showing signs of disease
- trestbps - resting blood pressure (in mm Hg on admission to the hospital)
- chol - serum cholestoral in mg/dl
- fbs - (fasting blood sugar > 120 mg/dl) (1 = true; 0 = false)
- '>126' mg/dL signals diabetes
- restecg - resting electrocardiographic results
- thalach - maximum heart rate achieved
- exang - exercise induced angina (1 = yes; 0 = no)
- oldpeak - ST depression induced by exercise relative to rest
- looks at stress of heart during excercise
- unhealthy heart will stress more
- slope - the slope of the peak exercise ST segment
- 0: Upsloping: better heart rate with excercise (uncommon)
- 1: Flatsloping: minimal change (typical healthy heart)
- 2: Downslopins: signs of unhealthy heart
- ca - number of major vessels (0-3) colored by flourosopy
- thal - thalium stress result
- 1,3: normal
- 6: fixed defect: used to be defect but ok now
- 7: reversable defect: no proper blood movement when excercising
- target - have disease or not (1=yes, 0=no) (= the predicted attribute)
Preparing/importing the tools for analysis and modeling
Pandas for data analysis.
NumPy for numerical operations.
Matplotlib/seaborn for plotting or data visualization.
Scikit-Learn for machine learning modelling and evaluation.
Data Analysis
Let's compare target column with sex column.
Heart disease frequency according to gender.
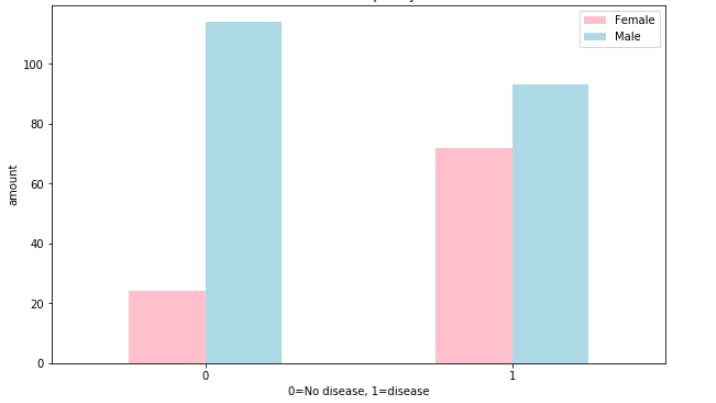
Since there are about 100 women and 72 of them have a positive value of heart disease being present, we might infer, based on this one variable if the participant is a woman, there's approximately 75% chance she has heart disease.
As for males, there's about 200 total with around half indicating a presence of heart disease. So we might predict, if the participant is male, approximately 50% of the time he will have heart disease.
Comparing Age and Max Heart Rate
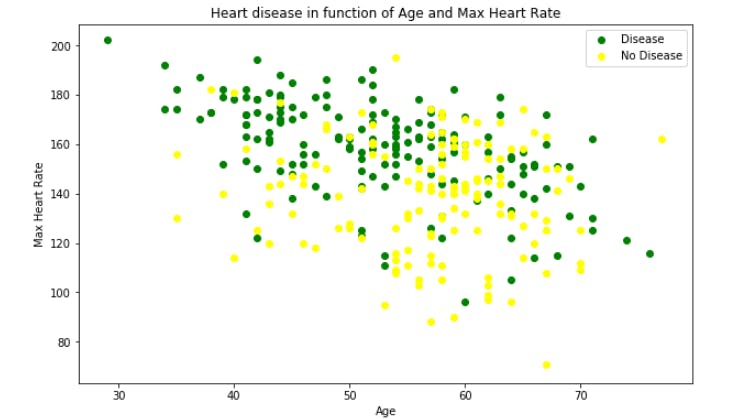
It seems the younger someone is, the higher their max heart rate (green dots are higher on the left of the graph)
Heart Disease Frequency per Chest Pain Type
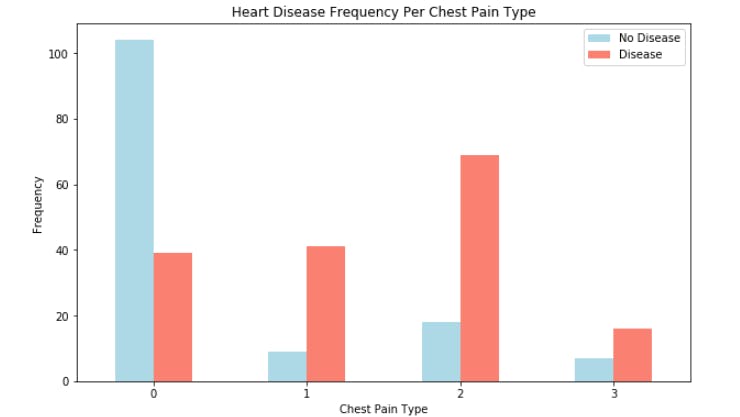
Atypical agina (value 1) states it's not related to the heart but seems to have a higher ratio of participants with heart disease than not. There is some confusion with the above data/graph.
Modeling
Now that we've explored the data, we'll try to use machine learning to predict our target variable based on the independent variables.
We're going to try 3 different machine learning models:
Logistic Regression
K-Nearest Neighbours Classifier
Random Forest Classifier
You can find the complete code Here
After modeling, The scores as follows
- 'KNN': 0.6885245901639344
- 'Logistic Regression': 0.8852459016393442
- 'Random Forest': 0.8360655737704918
As we can see Logistic Regression and Random Forest performs better than KNN.
Let us do Hyperparameter tuning and cross-validation.
Hyperparameter tuning - Each model you use has a series of dials you can turn to dictate how they perform. Changing these values may increase or decrease model performance.
Cross-validation - Splits your dataset into multiple parts and train and tests your model on each part and evaluates performance as an average.
Tuning both the models with with RandomizedSearchCV
You can find the code Here
After tuning the scores are Logistic Regression -- 0.8852459016393442 and RandomForest -- 0.8688524590163934
Tuning the hyper parameters for each model saw a slight performance boost. Since Logistic regression has higher value lets use Grid Search on logistic regression if we can see any more increase in score.
Tuning a model with GridSearchCV
Do you wonder what's the difference between RandomizedSearchCV and GridSearchCV?
RandomizedSearchCV - tries n_iter combinations of hyperparameters and saves the best.
GridSearchCV - tries every single combination of hyperparameters and saves the best.
After applying GridSearchCV, we got a score of 0.8852459016393442 which is same as RandomizedSearchCV
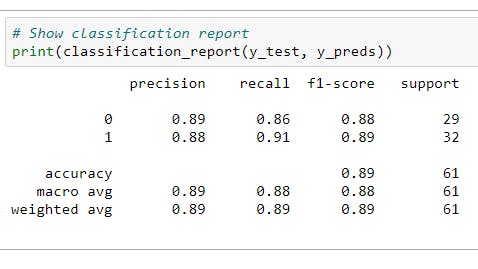
We will use few more metrics like precision, recall and F1-score at the same time.
Precision - Proportion of true positives over total number of samples. Higher precision leads to less false positives.
Recall - Proportion of true positives over total number of true positives and false negatives. Higher recall leads to less false negatives.
F1 score - Combines precision and recall into one metric. 1 is best, 0 is worst.
Classification report - Sklearn has a built-in function called classification_report() which returns some of the main classification metrics such as precision, recall and f1-score.
Classification report We can make a classification report using classification_report() and passing it the true labels as well as our models predicted labels.
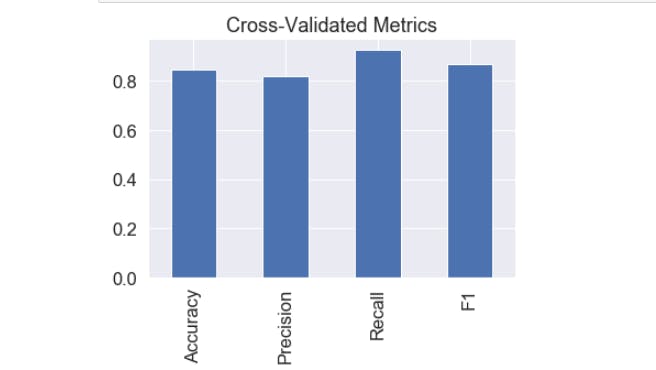
Since we have calculated our metrics using a single training and test set. We'll do to make them more solid by calculating them using cross-validation.
After calculating the scores with cross validation, the results are as follows.
Conclusion
Since Logistic Regression scored the high value, we can consider using Logistic regression.
We may not reach the 95 - 98% accuracy with the models, However machine learning techniques can be used to predict the output from existing data.