


Introduction:
In this article, I'll discuss a project I worked on. This project aims to predict the sale price of Bulldozers using machine learning models. Since the output variable we are trying to predict is a number. This kind of problem is known as a regression problem
You can check the complete code from Github repository. The approach is inspired from zerotomatery.io
Data:
The data and evaluation metric used is (root mean square log error or RMSLE) as this is a constraint from the Kaggle Bluebook for Bulldozers competition.
Looking at the dataset, we can understand that there's a time attribute to dataset. So it is Time series problem.
There are 3 datasets:
- Train.csv - Historical bulldozer sales examples up to 2011 (close to 400,000 examples with 50+ different attributes, including
SalePricewhich is the target variable). - Valid.csv - Historical bulldozer sales examples from January 1 2012 to April 30 2012 (close to 12,000 examples with the same attributes as Train.csv).
- Test.csv - Historical bulldozer sales examples from May 1 2012 to November 2012 (close to 12,000 examples but missing the
SalePriceattribute, as this is what we'll be trying to predict).
Data Exploration:
($) Parsing dates : When working with time series data, it's a good idea to make sure any date data is in the format of a datetime object (a Python data type which encodes specific information about dates).
($) Let's compare SalePrice and Saledate using Scatter plot
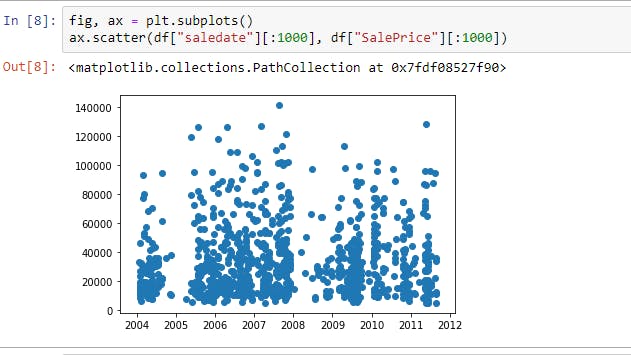
We can see that there are very less sales in 2005 and more sales between 2007 and 2008
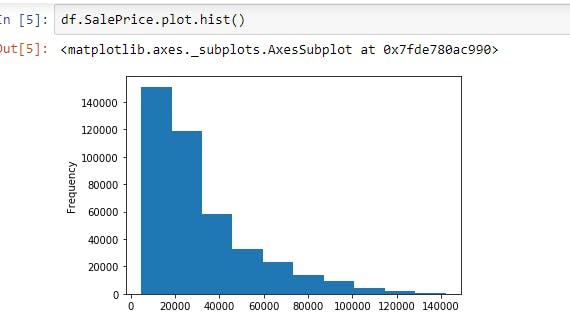
($) Let's us check the spread of SalePrice
($) As we're working on a time series problem and trying to predict future examples given past examples, it makes sense to sort our data by date.
df.sort_values(by=["saledate"], inplace=True, ascending=True)
($) Now Let's see if we have any missing values
# Check for missing values
df_tmp.isna().sum()
Yes, there are some values missing from some columns.
As we know ,
All of our data has to be numerical
There can't be any missing values
Convert strings to categories
One way to help turn all of our data into numbers is to convert the columns with the string datatype into a category datatype.
To do this we can use the pandas types API which allows us to interact and manipulate the types of data.
Once data is converted to categories turn them into codes and Filled missing values with Median of that column.
Once our data is in numeric format and there are no missing values, we should be able to build a machine learning model!
Splitting data into train/valid sets
As this is a time series problem, we will split our data into training, validation and test sets using the dates.
In our case:
- Training = all samples up until 2011
- Valid = all samples form January 1, 2012 - April 30, 2012
- Test = all samples from May 1, 2012 - November 2012
Modeling:
I've used RandomForestRegressor model.
Fit the train data to the model.
The evaluation function used here is root mean squared log error (RMSLE).
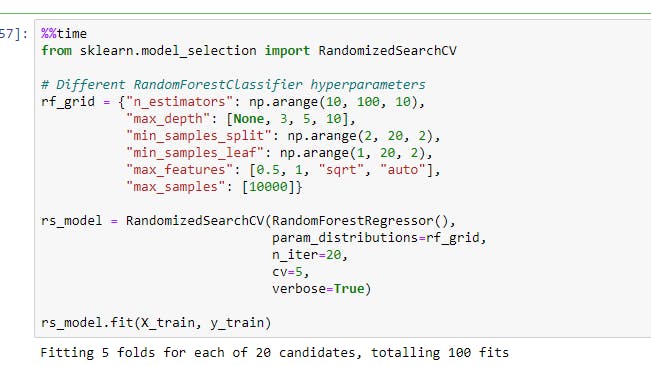
Hyperparameter tuning with RandomizedSearchCV
We can increase n_iter to try more combinations of hyperparameters but in our case, I've tried 20
We got best parameters as {'n_estimators': 90, 'min_samples_split': 4, 'min_samples_leaf': 1, 'max_samples': 10000, 'max_features': 0.5, 'max_depth': None}
Now Train a model with the best parameters.
The output is as follows:
{'Training MAE': 2538.086916839285, 'Valid MAE': 5921.566785123334,
'Training RMSLE': 0.12938511430324895, 'Valid RMSLE': 0.24299588986662657,
'Training R^2': 0.9672433268997953, 'Valid R^2': 0.8812702169749176}
Make predictions on test data
Our model has been trained on data formatted in the same way as the training data.
This means in order to make predictions on the test data, we need to take the same steps we used to preprocess the training data.
Also check if test and training data has same columns so that there will not be any further hassle.
Once preprocessing is done on test data, fit the test data to the model with best parameters.
Now we've built a model which is able to make predictions.